
Summary:
The new contextual visualization properties panel redefines how you configure visualizations in Spotfire in a powerful way. The new experience is more intuitive, efficient, and scalable than the classic Windows dialogs.
Why are we doing this?
Visual analytics is more sophisticated than ever. Analysts work with larger, more complex data sets and intricate visualization setups. The previous properties dialogs were not designed with this in mind. They were functional, but scattered across multiple windows, with different content depending on the visualization type. The panel improves the ease of use, makes visualization authoring more efficient, and creates a consistent experience in both the web client and the installed client.

The new panel replaces multiple windows with a single, contextual workspace, giving you a modern and productive workflow:
Instant overview
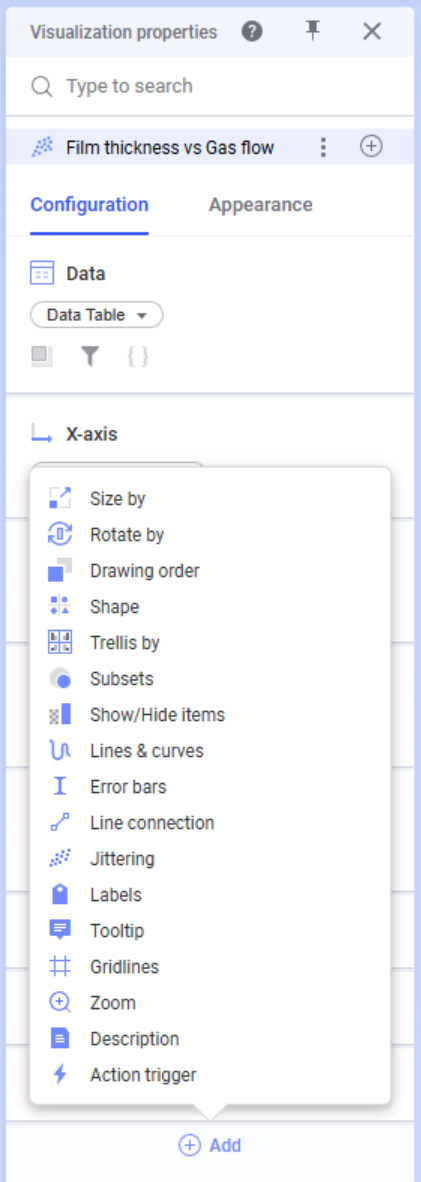
The panel shows only properties that are currently applied to the selected visualizations. This makes it easy to understand how visualizations are configured. You can enrich your visualizations by adding more properties (for example, colors, reference elements, custom shapes, labels).
Searchable
At the top of the panel, you can search for a property or setting that you would like to edit, or add to the selected visualization. You will find a matching property even if it is not currently applied. This makes advanced settings easier to discover.

Efficient
Select multiple visualizations (Ctrl + click) to instantly see and set shared properties, as well as highlight differences. This allows you to unify properties across complex visualizations in seconds, saving significant time. You can also reuse configurations across your visualizations through drag and drop.

Scalable
The new panel is designed for scale, and will make it possible to extend Spotfire with more visualization capabilities in the future. It unlocks new features that were difficult or impossible to integrate into the Windows dialogs.

Some of the new features enabled by the panel are visible in the image above. For example control limits, specification bands, trend lines, violin plot, and more.
Try it out
If you want to make this new and improved way of working with visualizations your default experience, starting with Spotfire 14.7, you can change the preference here: Visualization > Visualization properties > Default to contextual panel.
Learn more
- Spotfire Documentation
- Spotfire Ideas Portal to suggest features and improvements
Comments
0 comments
Article is closed for comments.